What is MACD?
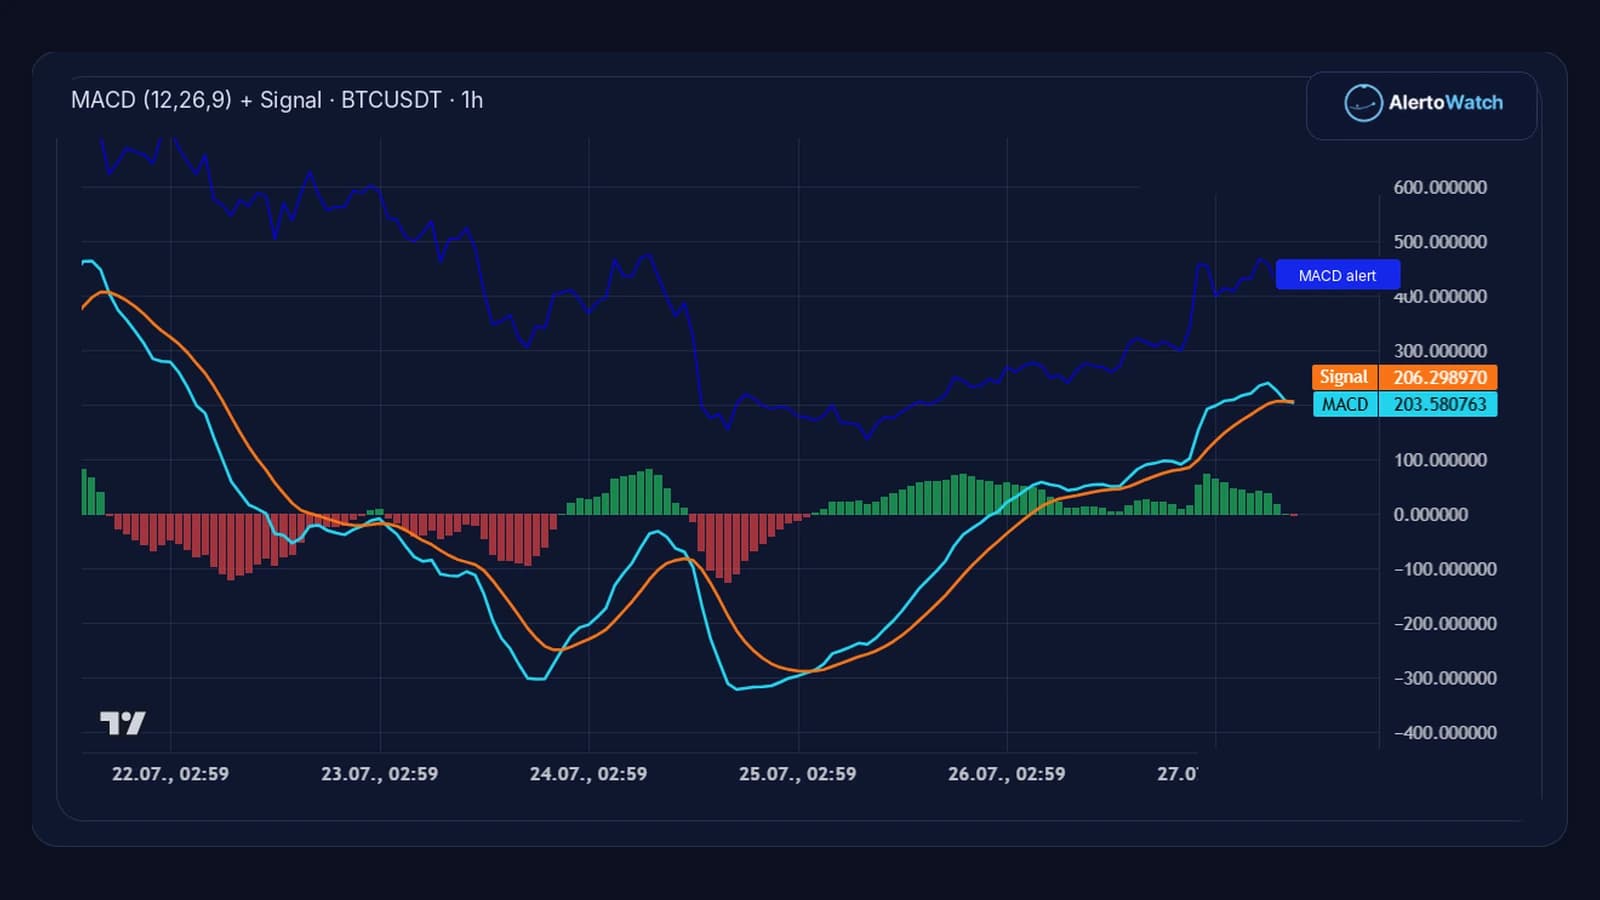
MACD is commonly represented by a main line, a signal line, and a histogram. Together they describe how the relationship between faster and slower EMA behavior changes over time.

Momentum
MACD, short for Moving Average Convergence Divergence, is a momentum and trend-following indicator derived from exponential moving averages.
MACD is commonly represented by a main line, a signal line, and a histogram. Together they describe how the relationship between faster and slower EMA behavior changes over time.
When shorter-term EMA behavior strengthens relative to longer-term behavior, the MACD main line tends to rise. The signal line smooths the main line, creating a supported crossover pair.
A main-line cross above the signal line is often interpreted as improving momentum, while a cross below is often interpreted as weakening momentum. Histogram changes can add visual context but are not a guarantee of direction.
Illustrative AlertoWatch chart
Turn the indicator relationship into a precise monitored condition. These are plain-English rule ideas, not recommendations or promises about market outcomes.
Related alert templates
Review a MACD main crossing above its signal line example.
View templateMACD is derived from moving averages and therefore lags price. Crosses can arrive late in fast markets or become noisy in sideways conditions.