What is RSI?
RSI is an oscillator that moves within a bounded range from 0 to 100. It compares recent gains and losses over a chosen lookback period and turns that information into a momentum reading.

Momentum
The Relative Strength Index, usually called RSI, measures the speed and magnitude of recent price changes. Traders often use it to monitor momentum strength, possible overbought or oversold conditions, and shifts in momentum.
RSI is an oscillator that moves within a bounded range from 0 to 100. It compares recent gains and losses over a chosen lookback period and turns that information into a momentum reading.
When gains have been relatively strong over the lookback window, RSI rises. When losses have been relatively strong, RSI falls. Reference zones such as 70 and 30 are common, but their meaning depends on market context and timeframe.
A higher RSI can suggest stronger recent upward momentum, while a lower RSI can suggest stronger downward momentum. Extreme readings do not mean price must reverse; strong trends can keep RSI elevated or depressed for extended periods.
Illustrative AlertoWatch chart
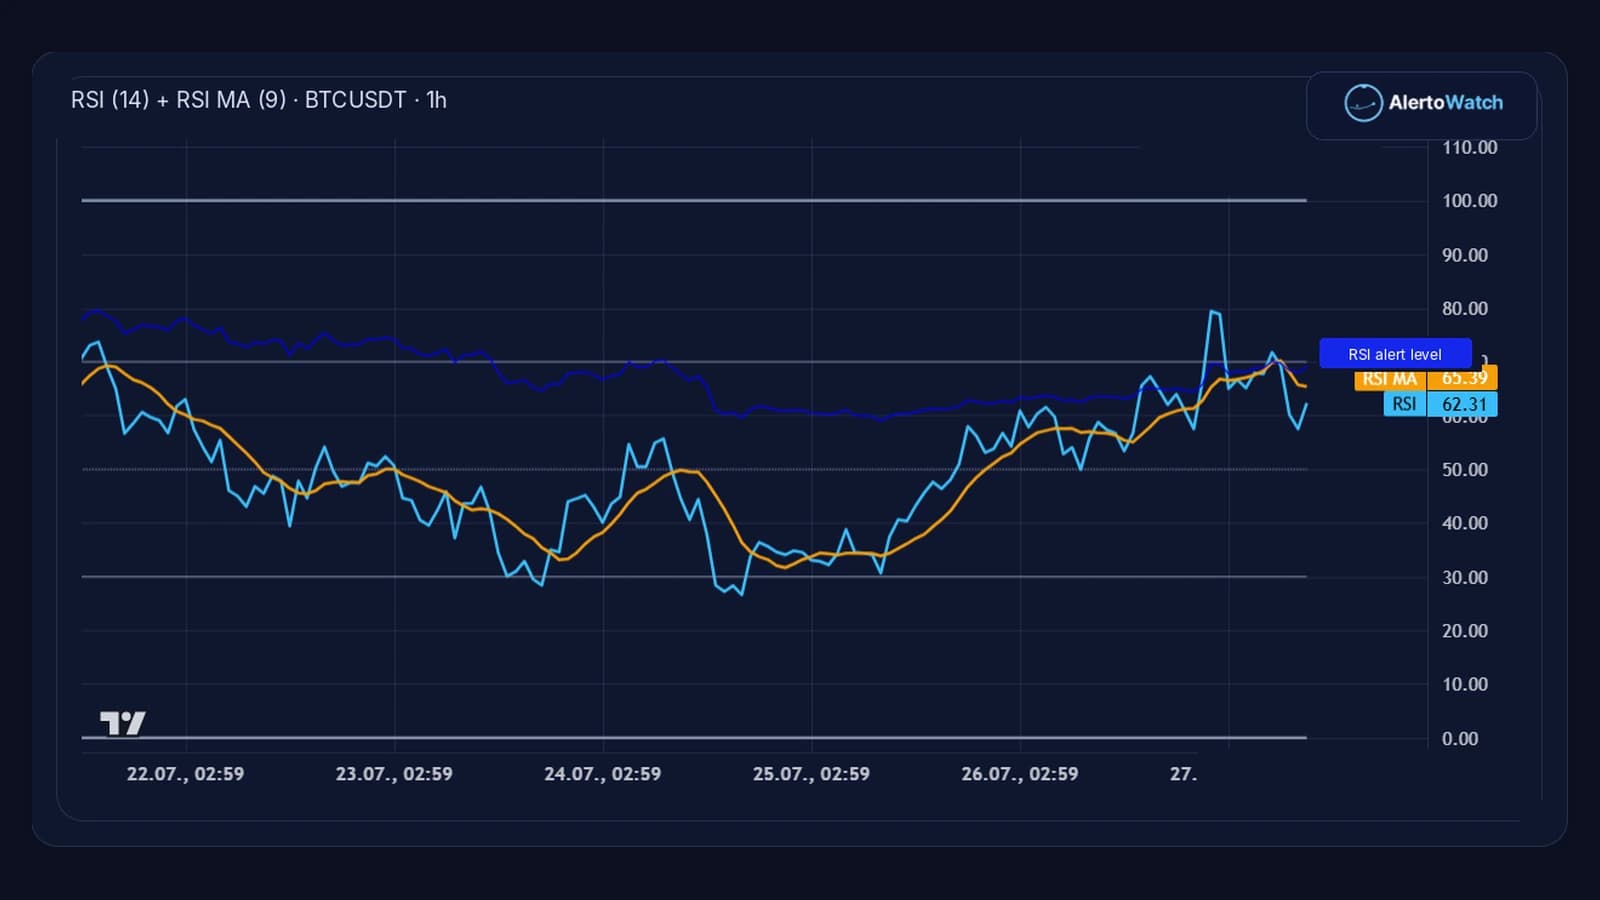
Bollinger Bands add volatility context to RSI readings near common extremes.
EMA direction can provide broader trend context for an RSI condition.
Volume helps describe the participation behind a momentum change.
Turn the indicator relationship into a precise monitored condition. These are plain-English rule ideas, not recommendations or promises about market outcomes.
Related alert templates
Review a current-value RSI 14 above 70 example.
View templateReview a current-value RSI 14 below 30 example.
View templateReview RSI 14 crossing above RSI MA 9 on 1h.
View templateRSI summarizes historical price movement and can remain extreme in strong trends. A threshold reading alone does not confirm a reversal, continuation, or trade opportunity.